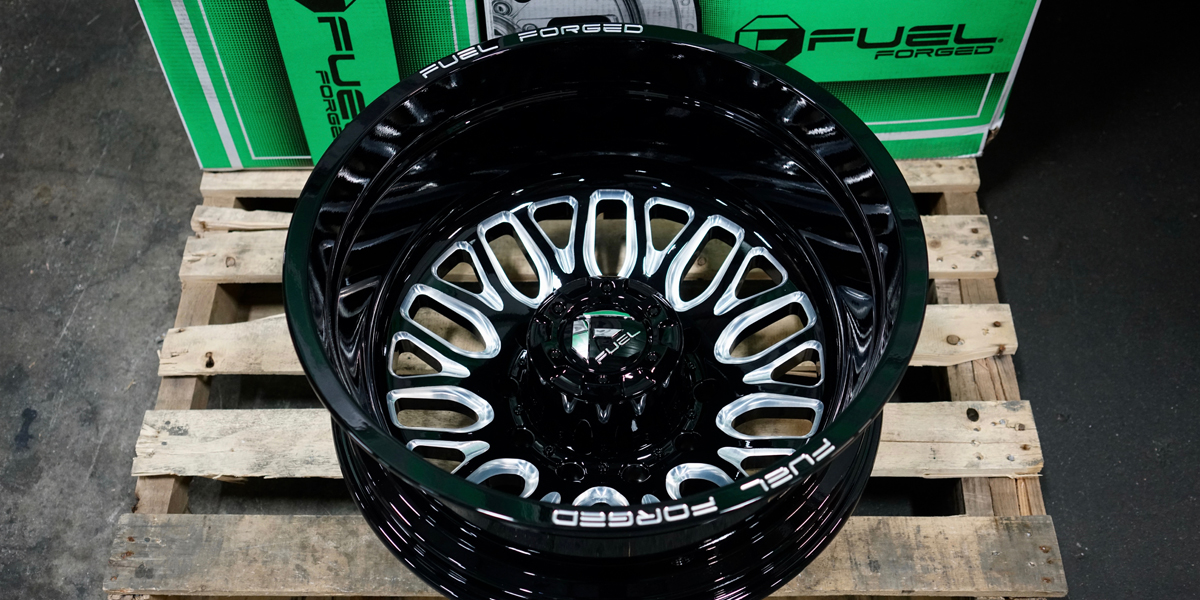
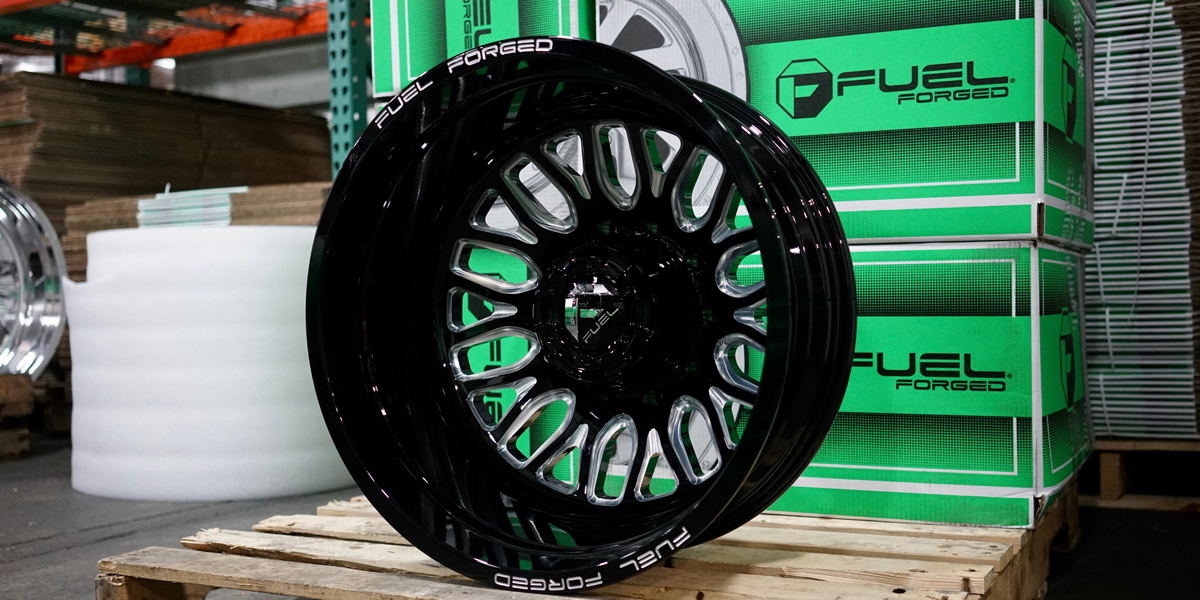
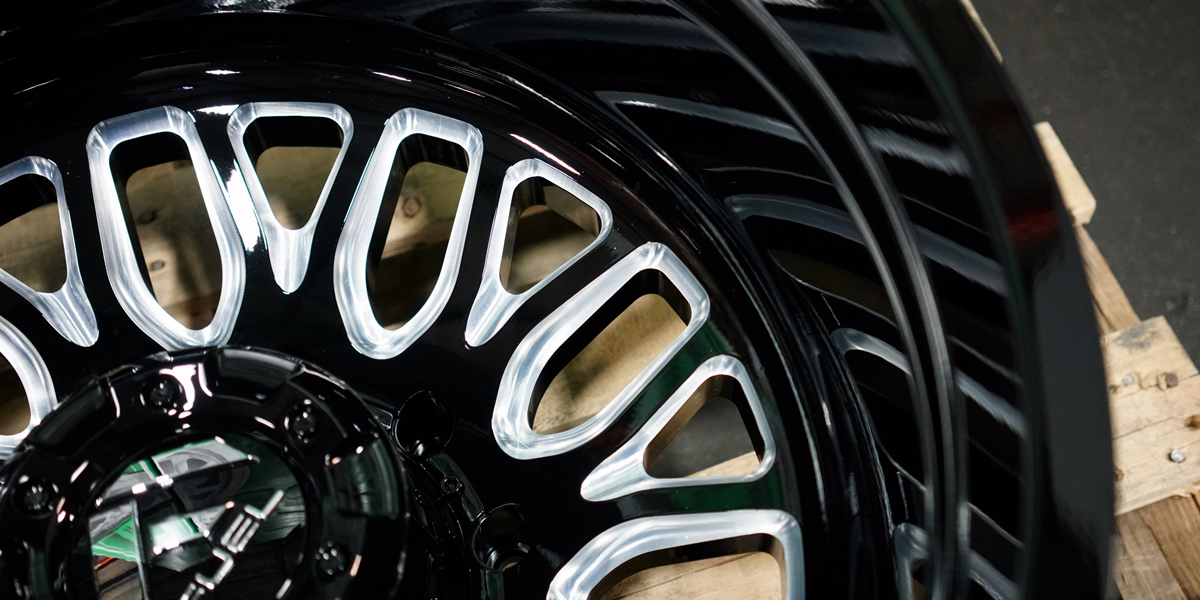

What is Atlassian Bamboo used for? Bamboo Server is a CI/CD solution which is part of the Atlassian suite of developer tools. It is available only in a self-managed configuration and is a closed source solution. Bamboo offers build, test, and deployment automation, and has tight integrations to Atlassian Bitbucket (for SCM) and Fisheye (for understanding how source code has changed), as well as integrations to over 150 other tools. In contrast, GitLab offers a git-based SCM, SCM integrations, and code change traceability out of the box in a single application.
Bamboo offers a GUI for defining build plans, and offers pipeline as code through Java and Yaml. Bamboo also offers deployment plans (which include the notion of environments and releases), pre-deployment visibility, and per-environment deployment permissions. GitLab also offers release tracking across environments and deep visibility into the changes in a deployment, but sets deployment permissions based on branch permissions.
Bamboo does not offer monitoring. GitLab includes monitoring as part of its single application.
Bamboo steps can be run in parallel across agents, and those agents can be auto-scaled based on need if Bamboo is configured for a feature called Elastic Bamboo. Elastic Bamboo requires the use of “remote agents”, which you pay extra for (see pricing). Organizations who want auto-scaling are also locked in to using Amazon Elastic Compute Cloud (EC2) and paying Amazon separately for their usage. In contrast, GitLab does not charge per remote agent (runner) and scales with a variety of cloud and container solutions.
Discussion from HackerNews article about Atlassian not allowing benchmarking > Atlassian has always forbidden to talk about the performance of their products in their ToS and in their previous EULA. We all know why, but we don’t talk about it.
From Twitter:
“we have also started using GitLab (moving from our own Bitbucket/Bamboo servers). The CI/CD is definitely an improvement but I’m not sold on the code review features of GitLab” https://twitter.com/carrchr/status/1003651960099176448
“Sweet. Unlike Atlassian’s Bamboo, @GitLab CI supports “[ci skip]” out of the box. #gitlab #devtools #success” https://twitter.com/tekkie/status/823689378371342336
“Nice and simple GUI in @GitLab CI as well. Much easier to navigate than Bamboo for instance. #gitlab #gui #ux #success” https://twitter.com/tekkie/status/839054544009117696
“Seriously, is still there a reason to use Jenkins/Hudson/TeamCity/Bamboo? I reckon @GitLab built-in CI support is sufficient for most of us!” https://twitter.com/AriyaHidayat/status/756919101587546112
“A day building pipelines in VSTS for one of my teams. Get the feeling that while I find it simple not everyone finds it the same. Better than Gitlab CI (IMO) but I like Bamboo a lot too…” https://twitter.com/xyglo/status/978291270161457152
From Bamboo open Issues
FEATURES |
![]() |
|
---|---|---|
Built-in CI/CD
GitLab has built-in Continuous Integration/Continuous Delivery, for free, no need to install it separately. Use it to build, test, and deploy your website (GitLab Pages) or webapp. The job results are displayed on merge requests for easy access. |
|
|
Runs with less memory and consumes less CPU power
Uses little memory, it runs fine with 512MB. Uses little CPU power since Go is a compiled language |
|
|
Application performance monitoring
GitLab collects and displays performance metrics for deployed apps, leveraging Prometheus. Developers can determine the impact of a merge and keep an eye on their production systems, without leaving GitLab. |
|
|
GitLab Self-monitoring
GitLab comes out of the box enabled for Prometheus monitoring with extensive instrumentation, making it easy to ensure your GitLab deployment is responsive and healthy. |
|
|
Project Level Value Stream Analytics
GitLab provides a dashboard that lets teams measure the time it takes to go from planning to monitoring. GitLab can provide this data because it has all the tools built-in: from the idea, to the CI, to code review, to deploy to production. |
|
|
Group Level Value Stream Analytics
GitLab provides a group dashboard that lets teams measure the time it takes to go from planning to monitoring. GitLab can provide this data because it has all the tools built-in: from the idea, to the CI, to code review, to deploy to production. |
|
|
Preview your changes with Review Apps
With GitLab CI/CD you can create a new environment for each one of your branches, speeding up your development process. Spin up dynamic environments for your merge requests with the ability to preview your branch in a live environment. Review Apps support both static and dynamic URLs. |
|
|
CI/CD Horizontal Autoscaling
GitLab CI/CD cloud native architecture can easily scale horizontally by adding new nodes if the workload increases. GitLab Runners can automatically spin up and down new containers to ensure pipelines are processed immediately and minimize costs. |
|
|
CI/CD Pipelines Dashboard
Visualize the history and current status of pipelines across projects and groups all in a single dashboard that can be customized for each user. Learn more about Cross-Project Pipelines in the Operations Dashboard |
|
|
Cloud Native
GitLab and its CI/CD is Cloud Native, purpose built for the cloud model. GitLab can be easily deployed on Kubernetes and used to deploy your application to Kubernetes with support out of the box. |
|
|
Container debugging with an integrated web terminal
Easily debug your containers in any of your environments using the built-in GitLab Web Terminal. GitLab can open a terminal session directly from your environment if your application is deployed on Kubernetes. This is a very powerful feature where you can quickly debug issues without leaving the comfort of your web browser. |
|
|
Comprehensive pipeline graphs
Pipelines can be complex structures with many sequential and parallel jobs. To make it a little easier to see what is going on, you can view a graph of a single pipeline and its status. |
|
|
Online visualization of HTML artifacts
Access your test reports, code quality and coverage information directly from your browser, with no need to download them locally. |
|
|
Browsable artifacts
With GitLab CI you can upload your job artifacts in GitLab itself without the need of an external service. Because of this, artifacts are also browsable through GitLab’s web interface. |
|
|
Latest artifacts locked to prevent deletion
The latest artifact of a successful job and pipeline on any active branch, MR, or tag is automatically locked to prevent being deleted. This makes it possible to set an aggressive expiration policy to clean up older artifacts, reduce disk space consumption, and ensure the latest artifact is always available. This default behavior is configurable at the project level and can be disabled in project settings. |
|
|
Scheduled triggering of pipelines
You can make your pipelines run on a schedule in a cron-like environment. |
|
|
Code Quality MR Widget
Code Quality reports are available in the merge request widget area, giving you early insights into how the change will affect the health of your code before deciding if you want to accept it. |
|
|
Code Quality Reports
Full Code Quality reports are available on the pipeline page, showing areas of the codebase that do not meet the organization’s preferred style or standards. |
|
|
Code Quality violation notices in MR diffs
Code Quality violations introduced in a merge request are annotated in the merge request diff view to detail how the code quality could decrease if merged. |
|
|
Multi-project pipeline graphs
With multi-project pipeline graphs you can see how upstream and downstream pipelines are linked together for projects that are linked to others via triggers as part of a more complex design, as it is for micro-services architecture. |
|
|
Protected variables
You can mark a variable as “protected” to make it available only to jobs running on protected branches, therefore only authorized users can get access to it. |
|
|
Environments and deployments
GitLab CI is capable of not only testing or building your projects, but also deploying them in your infrastructure, with the added benefit of giving you a way to track your deployments. Environments are like tags for your CI jobs, describing where code gets deployed. |
|
|
Per-environment permissions
Developers and QA can deploy to their own environments on demand while production stays locked down. Build engineers and ops teams spend less time servicing deploy requests, and can gate what goes into production. |
|
|
Environments history
Environments history allows you to see what is currently being deployed on your servers, and to access a detailed view for all the past deployments. From this list you can also re-deploy the current version, or even rollback an old stable one in case something went wrong. |
|
|
Environment-specific variables
Limit the environment scope of a variable by defining which environments it can be available for. |
|
|
Group-level variables
Define variables at the group level and use them in any project in the group. |
|
|
Show code coverage rate for your pipelines
GitLab is able to parse job output logs and search, via a customizable regex, any information created by tools like SimpleCov to get code coverage. Data is automatically available in the UI and also as a badge you can embed in any HTML page or publish using GitLab Pages. Learn how to generate and show code coverage information in GitLab |
|
|
Support for multiple Kubernetes clusters
Easily deploy different environments, like Staging and Production, to different Kubernetes clusters. This allows to enforce strict data separation. |
|
|
Bad test quarantine
Don’t let red builds become the norm. Across all tests, keep flaky or broken tests out of sight (but not out of mind), and keep the build green with one-click quarantine of tests. |
|
|